Compare Mean Fluorescence Intensity of Gated Events
[1]:
import os
import pandas as pd

import flowkit as fk

%matplotlib inline
Load FlowJo Workspace
[2]:
base_dir = "../../../data/8_color_data_set"

sample_path = os.path.join(base_dir, "fcs_files")
wsp_path = os.path.join(base_dir, "8_color_ICS.wsp")
[3]:
workspace = fk.Workspace(wsp_path, fcs_samples=sample_path)
[4]:
workspace.summary()
[4]:
| samples | loaded_samples | gates | max_gate_depth | |
|---|---|---|---|---|
| group_name | ||||
| All Samples | 3 | 3 | 14 | 6 |
| DEN | 3 | 3 | 14 | 6 |
| GEN | 0 | 0 | 0 | 0 |
| G69 | 0 | 0 | 0 | 0 |
| Lyo Cells | 0 | 0 | 0 | 0 |
[5]:
sample_ids = workspace.get_sample_ids('DEN')
[6]:
sample_ids
[6]:
['101_DEN084Y5_15_E01_008_clean.fcs',
 '101_DEN084Y5_15_E03_009_clean.fcs',
 '101_DEN084Y5_15_E05_010_clean.fcs']
[7]:
# choose a sample ID
sample_id = '101_DEN084Y5_15_E03_009_clean.fcs'
sample = workspace.get_sample(sample_id)
Review the gate hierachy
[8]:
print(workspace.get_gate_hierarchy(sample_id, 'ascii'))
root
╰── Time
    ╰── Singlets
        ╰── aAmine-
            ╰── CD3+
                ├── CD4+
                │   ├── CD107a+
                │   ├── IFNg+
                │   ├── IL2+
                │   ╰── TNFa+
                ╰── CD8+
                    ├── CD107a+
                    ├── IFNg+
                    ├── IL2+
                    ╰── TNFa+
Process gates for the sample group
[9]:
workspace.analyze_samples(sample_id=sample_id)
Get gated events for a sample
[10]:
cd4_gate_name = 'CD4+'
cd4_events = workspace.get_gate_events(sample_id, cd4_gate_name)
[11]:
sample.event_count, cd4_events.shape[0]
[11]:
(283969, 81855)
[12]:
cd4_events.head(5)
[12]:
| sample_id | FSC-A | FSC-H | FSC-W | SSC-A | SSC-H | SSC-W | TNFa FITC FLR-A | CD8 PerCP-Cy55 FLR-A | IL2 BV421 FLR-A | Aqua Amine FLR-A | IFNg APC FLR-A | CD3 APC-H7 FLR-A | CD107a PE FLR-A | CD4 PE-Cy7 FLR-A | Time | |
|---|---|---|---|---|---|---|---|---|---|---|---|---|---|---|---|---|
| 1 | 101_DEN084Y5_15_E03_009_clean.fcs | 0.484332 | 0.397831 | 0.304358 | 0.178974 | 0.165913 | 0.269681 | 0.242188 | 0.230791 | 0.282167 | 0.254901 | 0.244743 | 0.454572 | 0.276832 | 0.610560 | 0.029446 |
| 6 | 101_DEN084Y5_15_E03_009_clean.fcs | 0.858325 | 0.713455 | 0.300763 | 0.160702 | 0.149963 | 0.267902 | 0.255704 | 0.297297 | 0.270034 | 0.259815 | 0.232809 | 0.383849 | 0.272156 | 0.476992 | 0.029638 |
| 7 | 101_DEN084Y5_15_E03_009_clean.fcs | 0.499515 | 0.389256 | 0.320814 | 0.160819 | 0.148792 | 0.270207 | 0.542186 | 0.298411 | 0.430466 | 0.270496 | 0.720327 | 0.324062 | 0.353662 | 0.604535 | 0.029652 |
| 9 | 101_DEN084Y5_15_E03_009_clean.fcs | 0.427556 | 0.346325 | 0.308638 | 0.181880 | 0.169140 | 0.268832 | 0.256053 | 0.305138 | 0.332638 | 0.251144 | 0.226288 | 0.607199 | 0.369072 | 0.423495 | 0.029680 |
| 16 | 101_DEN084Y5_15_E03_009_clean.fcs | 0.527936 | 0.415756 | 0.317456 | 0.103247 | 0.096481 | 0.267532 | 0.241784 | 0.235227 | 0.283300 | 0.246906 | 0.251326 | 0.454224 | 0.306893 | 0.487684 | 0.029858 |
Calculate means for channels of interest
[13]:
fluoro_labels = []
for chan_idx in sample.fluoro_indices:
    fluoro_labels.append(sample.pnn_labels[chan_idx])
[14]:
cd4_events = cd4_events[fluoro_labels]
[15]:
cd4_mfi = cd4_events.mean()
[16]:
cd4_mfi
[16]:
TNFa FITC FLR-A         0.248338
CD8 PerCP-Cy55 FLR-A    0.274010
IL2 BV421 FLR-A         0.288348
Aqua Amine FLR-A        0.250962
IFNg APC FLR-A          0.246429
CD3 APC-H7 FLR-A        0.488177
CD107a PE FLR-A         0.279935
CD4 PE-Cy7 FLR-A        0.588879
dtype: float64
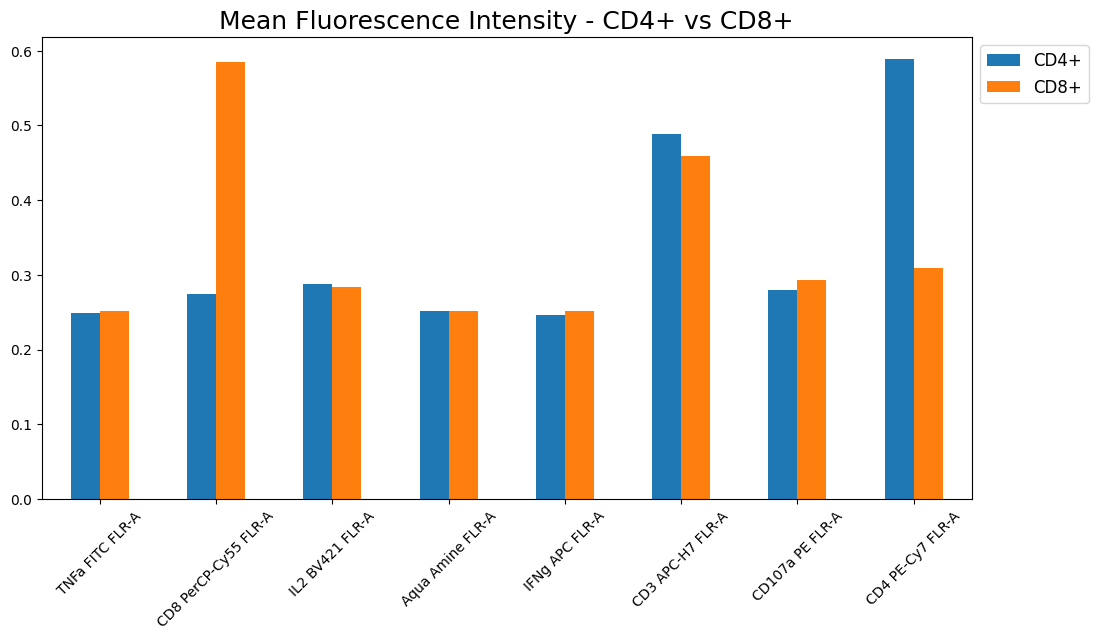
Let’s compare MFI between CD4+ & CD8+
[17]:
cd8_gate_name = 'CD8+'
cd8_events = workspace.get_gate_events(sample_id, cd8_gate_name)

cd8_mfi = cd8_events[fluoro_labels].mean()
[18]:
mfi_comp = pd.DataFrame([cd4_mfi, cd8_mfi], index=[cd4_gate_name, cd8_gate_name])
[19]:
mfi_comp
[19]:
| TNFa FITC FLR-A | CD8 PerCP-Cy55 FLR-A | IL2 BV421 FLR-A | Aqua Amine FLR-A | IFNg APC FLR-A | CD3 APC-H7 FLR-A | CD107a PE FLR-A | CD4 PE-Cy7 FLR-A | |
|---|---|---|---|---|---|---|---|---|
| CD4+ | 0.248338 | 0.274010 | 0.288348 | 0.250962 | 0.246429 | 0.488177 | 0.279935 | 0.588879 |
| CD8+ | 0.250975 | 0.584248 | 0.283504 | 0.251208 | 0.252061 | 0.459689 | 0.292997 | 0.308986 |
[20]:
mfi_comp = mfi_comp.transpose()
[21]:
mfi_comp
[21]:
| CD4+ | CD8+ | |
|---|---|---|
| TNFa FITC FLR-A | 0.248338 | 0.250975 |
| CD8 PerCP-Cy55 FLR-A | 0.274010 | 0.584248 |
| IL2 BV421 FLR-A | 0.288348 | 0.283504 |
| Aqua Amine FLR-A | 0.250962 | 0.251208 |
| IFNg APC FLR-A | 0.246429 | 0.252061 |
| CD3 APC-H7 FLR-A | 0.488177 | 0.459689 |
| CD107a PE FLR-A | 0.279935 | 0.292997 |
| CD4 PE-Cy7 FLR-A | 0.588879 | 0.308986 |
[22]:
ax = mfi_comp.plot.bar(figsize=(12, 6))
ax.set_title("Mean Fluorescence Intensity - CD4+ vs CD8+", color='black', fontsize=18)
ax.legend(bbox_to_anchor=(1.0, 1.0), fontsize=12)
ax.set_xticklabels(ax.get_xticklabels(), rotation=45)
ax.plot()
[22]:
[]

[ ]: