Saving Flow Analysis Data as AnnData objects for ScanPy
This notebook requires the installation of the following additional packages:
matplotlib
anndata
scanpy
joypy
[1]:
import os
import anndata as ad
import matplotlib.pyplot as plt
from matplotlib.pyplot import rc_context
import numpy as np
import pandas as pd
import scanpy as sc
import joypy
import flowkit as fk
Create AnnData object from FlowJo Workspace analysis
Import FlowJo workspace and process samples
[2]:
base_dir = "../../../data/8_color_data_set"
sample_path = os.path.join(base_dir, "fcs_files")
wsp_path = os.path.join(base_dir, "8_color_ICS.wsp")

seed = 123
[3]:
workspace = fk.Workspace(wsp_path, fcs_samples=sample_path)
[4]:
workspace.summary()
[4]:
| samples | loaded_samples | gates | max_gate_depth | |
|---|---|---|---|---|
| group_name | ||||
| All Samples | 3 | 3 | 14 | 6 |
| DEN | 3 | 3 | 14 | 6 |
| GEN | 0 | 0 | 0 | 0 |
| G69 | 0 | 0 | 0 | 0 |
| Lyo Cells | 0 | 0 | 0 | 0 |
[5]:
# The 'DEN' group has the analysis of interest
sample_group = 'DEN'
sample_ids = workspace.get_sample_ids(group_name=sample_group)
[6]:
# check the event counts for all samples (just for sanity checking our data)
for sample_id in sample_ids:
    sample = workspace.get_sample(sample_id)
    print(sample_id, sample.event_count)
101_DEN084Y5_15_E01_008_clean.fcs 290172
101_DEN084Y5_15_E03_009_clean.fcs 283969
101_DEN084Y5_15_E05_010_clean.fcs 285290
[7]:
workspace.analyze_samples(sample_group)
Get Boolean arrays of gate membership for all events for all gates for each sample
[8]:
# DataFrame to hold gate membership data, columns are gates, rows are events
df_gate_membership = pd.DataFrame()

# choose a sample to get the gates from, we assume all samples have the same gate tree
for gate_name, gate_path in workspace.get_gate_ids(sample_ids[0]):
    results = []
    for sample_id in sample_ids:
        result = workspace.get_gate_membership(
            sample_id,
            gate_name=gate_name,
            gate_path=gate_path
        )
        results.append(result)

    results = np.concatenate(results)
    df_gate_membership[':'.join(list(gate_path) + [gate_name])] = results
[9]:
df_gate_membership.head()
[9]:
| root:Time | root:Time:Singlets | root:Time:Singlets:aAmine- | root:Time:Singlets:aAmine-:CD3+ | root:Time:Singlets:aAmine-:CD3+:CD4+ | root:Time:Singlets:aAmine-:CD3+:CD4+:CD107a+ | root:Time:Singlets:aAmine-:CD3+:CD4+:IFNg+ | root:Time:Singlets:aAmine-:CD3+:CD4+:IL2+ | root:Time:Singlets:aAmine-:CD3+:CD4+:TNFa+ | root:Time:Singlets:aAmine-:CD3+:CD8+ | root:Time:Singlets:aAmine-:CD3+:CD8+:CD107a+ | root:Time:Singlets:aAmine-:CD3+:CD8+:IFNg+ | root:Time:Singlets:aAmine-:CD3+:CD8+:IL2+ | root:Time:Singlets:aAmine-:CD3+:CD8+:TNFa+ | |
|---|---|---|---|---|---|---|---|---|---|---|---|---|---|---|
| 0 | False | False | False | False | False | False | False | False | False | False | False | False | False | False |
| 1 | False | False | False | False | False | False | False | False | False | False | False | False | False | False |
| 2 | False | False | False | False | False | False | False | False | False | False | False | False | False | False |
| 3 | False | False | False | False | False | False | False | False | False | False | False | False | False | False |
| 4 | False | False | False | False | False | False | False | False | False | False | False | False | False | False |
[10]:
# verify our event count looks right
df_gate_membership.shape
[10]:
(859431, 14)
Get processed events for all samples
A FlowJo workspace has a set of transforms, one for each channel in a sample. However, all samples are not guaranteed to have the same set of transforms, so always good to check them.
We’ll use the get_gate_events method without specifying the gate to get processed events for the root level (i.e. all events for each sample).
[11]:
df_processed_events = []

for sample_id in sample_ids:
    # The get_gate_events method returns all events if not given a gate
    df = workspace.get_gate_events(sample_id)
    df_processed_events.append(df)

df_processed_events = pd.concat(df_processed_events)
[12]:
df_processed_events.shape
[12]:
(859431, 16)
[13]:
df_processed_events.head()
[13]:
| sample_id | FSC-A | FSC-H | FSC-W | SSC-A | SSC-H | SSC-W | TNFa FITC FLR-A | CD8 PerCP-Cy55 FLR-A | IL2 BV421 FLR-A | Aqua Amine FLR-A | IFNg APC FLR-A | CD3 APC-H7 FLR-A | CD107a PE FLR-A | CD4 PE-Cy7 FLR-A | Time | |
|---|---|---|---|---|---|---|---|---|---|---|---|---|---|---|---|---|
| 0 | 101_DEN084Y5_15_E01_008_clean.fcs | 0.669193 | 0.550243 | 0.304044 | 0.145722 | 0.136929 | 0.266054 | 0.246065 | 0.297479 | 0.280577 | 0.248555 | 0.255891 | 0.532903 | 0.300733 | 0.566413 | 0.035940 |
| 1 | 101_DEN084Y5_15_E01_008_clean.fcs | 0.470615 | 0.405136 | 0.290405 | 0.200456 | 0.187286 | 0.267580 | 0.243213 | 0.402105 | 0.281486 | 0.245255 | 0.249686 | 0.212227 | 0.278771 | 0.244356 | 0.035983 |
| 2 | 101_DEN084Y5_15_E01_008_clean.fcs | 0.618339 | 0.518814 | 0.297958 | 0.165320 | 0.157120 | 0.263048 | 0.236940 | 0.638401 | 0.275555 | 0.247613 | 0.247531 | 0.466408 | 0.281839 | 0.268400 | 0.036026 |
| 3 | 101_DEN084Y5_15_E01_008_clean.fcs | 0.466790 | 0.384033 | 0.303874 | 0.136375 | 0.127686 | 0.267014 | 0.241100 | 0.646098 | 0.272339 | 0.249497 | 0.249413 | 0.433891 | 0.275977 | 0.238305 | 0.036040 |
| 4 | 101_DEN084Y5_15_E01_008_clean.fcs | 0.321537 | 0.268814 | 0.299033 | 0.119671 | 0.111221 | 0.268994 | 0.248873 | 0.478198 | 0.328231 | 0.258179 | 0.231071 | 0.487078 | 0.328163 | 0.288373 | 0.036068 |
Create AnnData object
The initial data will be the processed events
[14]:
# event values without the sample_id column
data = df_processed_events.iloc[:, 1:].values
[15]:
adata = ad.AnnData(data)
[16]:
adata.X
[16]:
array([[0.66919339, 0.55024338, 0.30404428, ..., 0.30073305, 0.56641316,
        0.03594016],
       [0.47061452, 0.40513611, 0.29040521, ..., 0.27877141, 0.24435586,
        0.03598285],
       [0.6183387 , 0.51881409, 0.29795775, ..., 0.28183939, 0.26840002,
        0.03602554],
       ...,
       [0.49872547, 0.42063522, 0.29641208, ..., 0.27990703, 0.61764152,
        0.98959426],
       [0.5290575 , 0.34724426, 0.38089722, ..., 0.61813569, 0.52649112,
        0.98960942],
       [0.39496988, 0.33108139, 0.2982423 , ..., 0.43869763, 0.62046722,
        0.98960942]], shape=(859431, 15))
Event labels
Basically just using an index for the event labels
[17]:
adata.obs_names = np.arange(adata.shape[0]).astype('str')
Marker labels
[18]:
adata.var_names = df_processed_events.columns[1:]
Attach sample information to each event
[19]:
adata.obs['sample_id'] = pd.Categorical(df_processed_events.sample_id)
[20]:
adata.obs.head(3)
[20]:
| sample_id | |
|---|---|
| 0 | 101_DEN084Y5_15_E01_008_clean.fcs |
| 1 | 101_DEN084Y5_15_E01_008_clean.fcs |
| 2 | 101_DEN084Y5_15_E01_008_clean.fcs |
[21]:
adata
[21]:
AnnData object with n_obs × n_vars = 859431 × 15
    obs: 'sample_id'
Add Boolean matrix of gate indices
[22]:
adata.obs['sample_id'].index
[22]:
Index(['0', '1', '2', '3', '4', '5', '6', '7', '8', '9',
       ...
       '859421', '859422', '859423', '859424', '859425', '859426', '859427',
       '859428', '859429', '859430'],
      dtype='object', length=859431)
[23]:
df_gate_membership.index = adata.obs['sample_id'].index
adata.obsm['gate_membership'] = df_gate_membership
[24]:
adata
[24]:
AnnData object with n_obs × n_vars = 859431 × 15
    obs: 'sample_id'
    obsm: 'gate_membership'
Add unstructured data for gating hierarchy and transforms
Need to convert transforms to str or cannot save to HDF5
[25]:
gate_hierarchy = {sample_id: str(workspace.get_gate_hierarchy(sample_id)) for sample_id in sample_ids}
[26]:
adata.uns['gate_hierarchy'] = gate_hierarchy
[27]:
transforms = {sample_id: str(workspace.get_transforms(sample_id)) for sample_id in sample_ids}
[28]:
adata.uns['transforms'] = transforms
Add marker summary statistics
[29]:
len(df_processed_events.columns)
[29]:
16
[30]:
df_processed_events.iloc[:10, 1:].describe()
[30]:
| FSC-A | FSC-H | FSC-W | SSC-A | SSC-H | SSC-W | TNFa FITC FLR-A | CD8 PerCP-Cy55 FLR-A | IL2 BV421 FLR-A | Aqua Amine FLR-A | IFNg APC FLR-A | CD3 APC-H7 FLR-A | CD107a PE FLR-A | CD4 PE-Cy7 FLR-A | Time | |
|---|---|---|---|---|---|---|---|---|---|---|---|---|---|---|---|
| count | 10.000000 | 10.000000 | 10.000000 | 10.000000 | 10.000000 | 10.000000 | 10.000000 | 10.000000 | 10.000000 | 10.000000 | 10.000000 | 10.000000 | 10.000000 | 10.000000 | 10.000000 |
| mean | 0.513847 | 0.424834 | 0.302854 | 0.175841 | 0.162928 | 0.268044 | 0.276783 | 0.414877 | 0.299048 | 0.256286 | 0.249117 | 0.393632 | 0.335131 | 0.358282 | 0.036195 |
| std | 0.112951 | 0.095721 | 0.007951 | 0.070695 | 0.060752 | 0.006297 | 0.098275 | 0.158428 | 0.044753 | 0.017757 | 0.014083 | 0.118088 | 0.130052 | 0.147533 | 0.000199 |
| min | 0.321537 | 0.268814 | 0.290405 | 0.116014 | 0.111221 | 0.260397 | 0.236940 | 0.225618 | 0.252084 | 0.245255 | 0.231071 | 0.212227 | 0.275977 | 0.238305 | 0.035940 |
| 25% | 0.437982 | 0.350256 | 0.298274 | 0.123847 | 0.116333 | 0.264272 | 0.242302 | 0.304357 | 0.273143 | 0.248555 | 0.238181 | 0.283199 | 0.279538 | 0.259192 | 0.036029 |
| 50% | 0.492692 | 0.418480 | 0.301504 | 0.155521 | 0.147024 | 0.266997 | 0.245685 | 0.365606 | 0.281031 | 0.249967 | 0.248472 | 0.426616 | 0.292071 | 0.282596 | 0.036189 |
| 75% | 0.613940 | 0.514628 | 0.304434 | 0.200421 | 0.186127 | 0.268640 | 0.252712 | 0.544173 | 0.326186 | 0.256070 | 0.254340 | 0.481910 | 0.315959 | 0.486388 | 0.036374 |
| max | 0.669193 | 0.550243 | 0.315916 | 0.349897 | 0.309628 | 0.282515 | 0.556043 | 0.646098 | 0.397557 | 0.305441 | 0.272172 | 0.532903 | 0.701451 | 0.594672 | 0.036452 |
[31]:
df_processed_events.head(4)
[31]:
| sample_id | FSC-A | FSC-H | FSC-W | SSC-A | SSC-H | SSC-W | TNFa FITC FLR-A | CD8 PerCP-Cy55 FLR-A | IL2 BV421 FLR-A | Aqua Amine FLR-A | IFNg APC FLR-A | CD3 APC-H7 FLR-A | CD107a PE FLR-A | CD4 PE-Cy7 FLR-A | Time | |
|---|---|---|---|---|---|---|---|---|---|---|---|---|---|---|---|---|
| 0 | 101_DEN084Y5_15_E01_008_clean.fcs | 0.669193 | 0.550243 | 0.304044 | 0.145722 | 0.136929 | 0.266054 | 0.246065 | 0.297479 | 0.280577 | 0.248555 | 0.255891 | 0.532903 | 0.300733 | 0.566413 | 0.035940 |
| 1 | 101_DEN084Y5_15_E01_008_clean.fcs | 0.470615 | 0.405136 | 0.290405 | 0.200456 | 0.187286 | 0.267580 | 0.243213 | 0.402105 | 0.281486 | 0.245255 | 0.249686 | 0.212227 | 0.278771 | 0.244356 | 0.035983 |
| 2 | 101_DEN084Y5_15_E01_008_clean.fcs | 0.618339 | 0.518814 | 0.297958 | 0.165320 | 0.157120 | 0.263048 | 0.236940 | 0.638401 | 0.275555 | 0.247613 | 0.247531 | 0.466408 | 0.281839 | 0.268400 | 0.036026 |
| 3 | 101_DEN084Y5_15_E01_008_clean.fcs | 0.466790 | 0.384033 | 0.303874 | 0.136375 | 0.127686 | 0.267014 | 0.241100 | 0.646098 | 0.272339 | 0.249497 | 0.249413 | 0.433891 | 0.275977 | 0.238305 | 0.036040 |
Optionally save to disk
At this point we could save the AnnData object to disk for later processing:
adata.write('8_color_data_set.h5ad', compression="gzip")
Apply scanpy to AnnData object
[32]:
adata.var_names
[32]:
Index(['FSC-A', 'FSC-H', 'FSC-W', 'SSC-A', 'SSC-H', 'SSC-W', 'TNFa FITC FLR-A',
       'CD8 PerCP-Cy55 FLR-A', 'IL2 BV421 FLR-A', 'Aqua Amine FLR-A',
       'IFNg APC FLR-A', 'CD3 APC-H7 FLR-A', 'CD107a PE FLR-A',
       'CD4 PE-Cy7 FLR-A', 'Time'],
      dtype='object')
[33]:
# Only keep fluroescence intensity markers
exclude = ['FSC-A', 'FSC-H', 'FSC-W', 'SSC-A', 'SSC-H', 'SSC-W', 'Time']
adata = adata[:, ~adata.var_names.isin(exclude)]
[34]:
markers = [
    'Aqua Amine FLR-A',
    'CD3 APC-H7 FLR-A',
    'CD4 PE-Cy7 FLR-A',
    'CD8 PerCP-Cy55 FLR-A',
    'TNFa FITC FLR-A',
    'IL2 BV421 FLR-A',
    'IFNg APC FLR-A',
    'CD107a PE FLR-A',
]
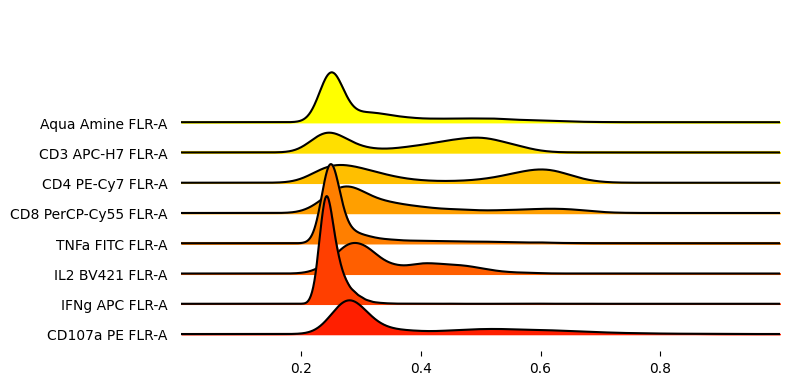
[35]:
_ = joypy.joyplot(
    adata.to_df().sample(10_000),
    figsize=(8,4),
    column = markers,
    x_range=[0, 1],
    colormap=plt.cm.autumn_r,
    overlap=1.5
)
[36]:
# just to reference indices of gate names
pd.Series(adata.obsm['gate_membership'].columns)
[36]:
0                                        root:Time
1                               root:Time:Singlets
2                       root:Time:Singlets:aAmine-
3                  root:Time:Singlets:aAmine-:CD3+
4             root:Time:Singlets:aAmine-:CD3+:CD4+
5     root:Time:Singlets:aAmine-:CD3+:CD4+:CD107a+
6       root:Time:Singlets:aAmine-:CD3+:CD4+:IFNg+
7        root:Time:Singlets:aAmine-:CD3+:CD4+:IL2+
8       root:Time:Singlets:aAmine-:CD3+:CD4+:TNFa+
9             root:Time:Singlets:aAmine-:CD3+:CD8+
10    root:Time:Singlets:aAmine-:CD3+:CD8+:CD107a+
11      root:Time:Singlets:aAmine-:CD3+:CD8+:IFNg+
12       root:Time:Singlets:aAmine-:CD3+:CD8+:IL2+
13      root:Time:Singlets:aAmine-:CD3+:CD8+:TNFa+
dtype: object
[37]:
cd4_funcs = adata.obsm['gate_membership'].iloc[:, [5,6,7,8]]
cd4_bool = cd4_funcs.apply(lambda xs: np.sum([x*2**i for (i, x) in enumerate(xs)]), axis=1)
cd4_num_funcs = cd4_funcs.apply(lambda xs: xs.sum(), axis=1)
[38]:
adata.obs['cd4'] = pd.Categorical(adata.obsm['gate_membership'].iloc[:, 4].astype(int).astype('str'))
adata.obs['cd4_bool'] = pd.Categorical(cd4_bool.astype('str').str.zfill(2))
adata.obs['cd4_funcs'] = pd.Categorical(cd4_num_funcs.astype('str'))
/tmp/ipykernel_4184313/3070510497.py:1: ImplicitModificationWarning: Trying to modify attribute `.obs` of view, initializing view as actual.
  adata.obs['cd4'] = pd.Categorical(adata.obsm['gate_membership'].iloc[:, 4].astype(int).astype('str'))
[39]:
cd8_funcs = adata.obsm['gate_membership'].iloc[:, [10,11,12,13]]
cd8_bool = cd8_funcs.apply(lambda xs: np.sum([x*2**i for (i, x) in enumerate(xs)]), axis=1)
cd8_num_funcs = cd8_funcs.apply(lambda xs: xs.sum(), axis=1)
[40]:
adata.obs['cd8'] = pd.Categorical(adata.obsm['gate_membership'].iloc[:, 9].astype('int').astype('str'))
adata.obs['cd8_bool'] = pd.Categorical(cd8_bool.astype('str').str.zfill(2))
adata.obs['cd8_funcs'] = pd.Categorical(cd8_num_funcs.astype('str'))
Computing the neighborhood graph
To speed up UMAP calculations,
pip install pynndescent
[41]:
# Subsample to speed things up
data = sc.pp.subsample(adata, n_obs=50_000, copy=True)
[42]:
%%time
sc.pp.neighbors(data, n_neighbors=10, n_pcs=0)
CPU times: user 23.4 s, sys: 136 ms, total: 23.5 s
Wall time: 23.2 s
[43]:
%%time
sc.tl.leiden(data, resolution=0.1, flavor='leidenalg')
<timed eval>:1: FutureWarning: In the future, the default backend for leiden will be igraph instead of leidenalg.

 To achieve the future defaults please pass: flavor="igraph" and n_iterations=2.  directed must also be False to work with igraph's implementation.
CPU times: user 8.63 s, sys: 69.3 ms, total: 8.7 s
Wall time: 8.67 s
[44]:
%%time
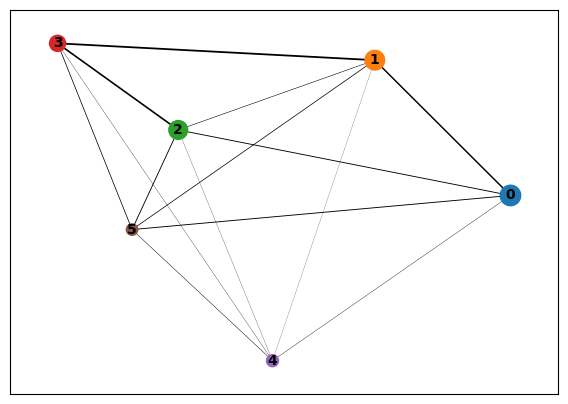
sc.tl.paga(data)
CPU times: user 247 ms, sys: 21 ms, total: 268 ms
Wall time: 267 ms
[45]:
sc.pl.paga(data)
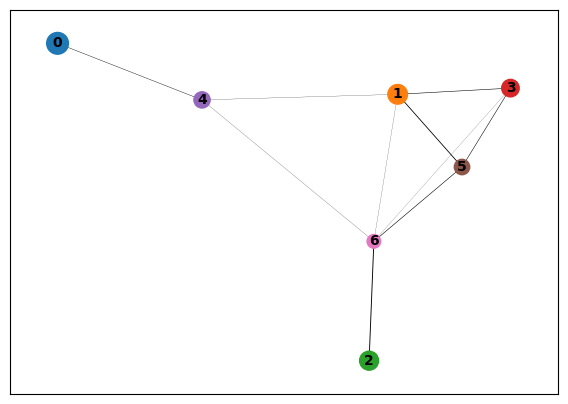
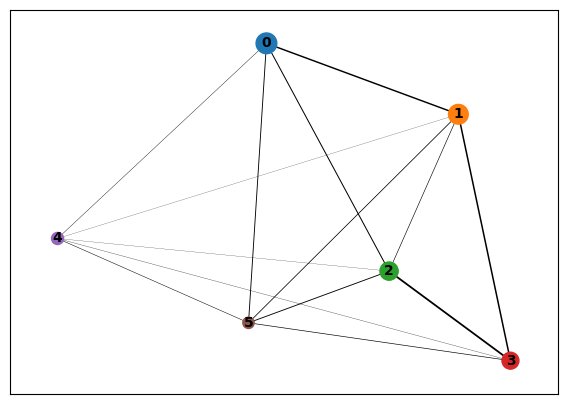
By quantifying the connectivity of partitions (groups, clusters) of the single-cell graph, partition-based graph abstraction (PAGA) generates a much simpler abstracted graph (PAGA graph) of partitions, in which edge weights represent confidence in the presence of connections. By thresholding this confidence in :func:~scanpy.pl.paga, a much simpler representation of the manifold data is obtained, which is nonetheless faithful to the topology of the manifold.
[46]:
%%time
sc.tl.umap(data, init_pos='paga')
CPU times: user 15.1 s, sys: 1.07 ms, total: 15.1 s
Wall time: 15.1 s
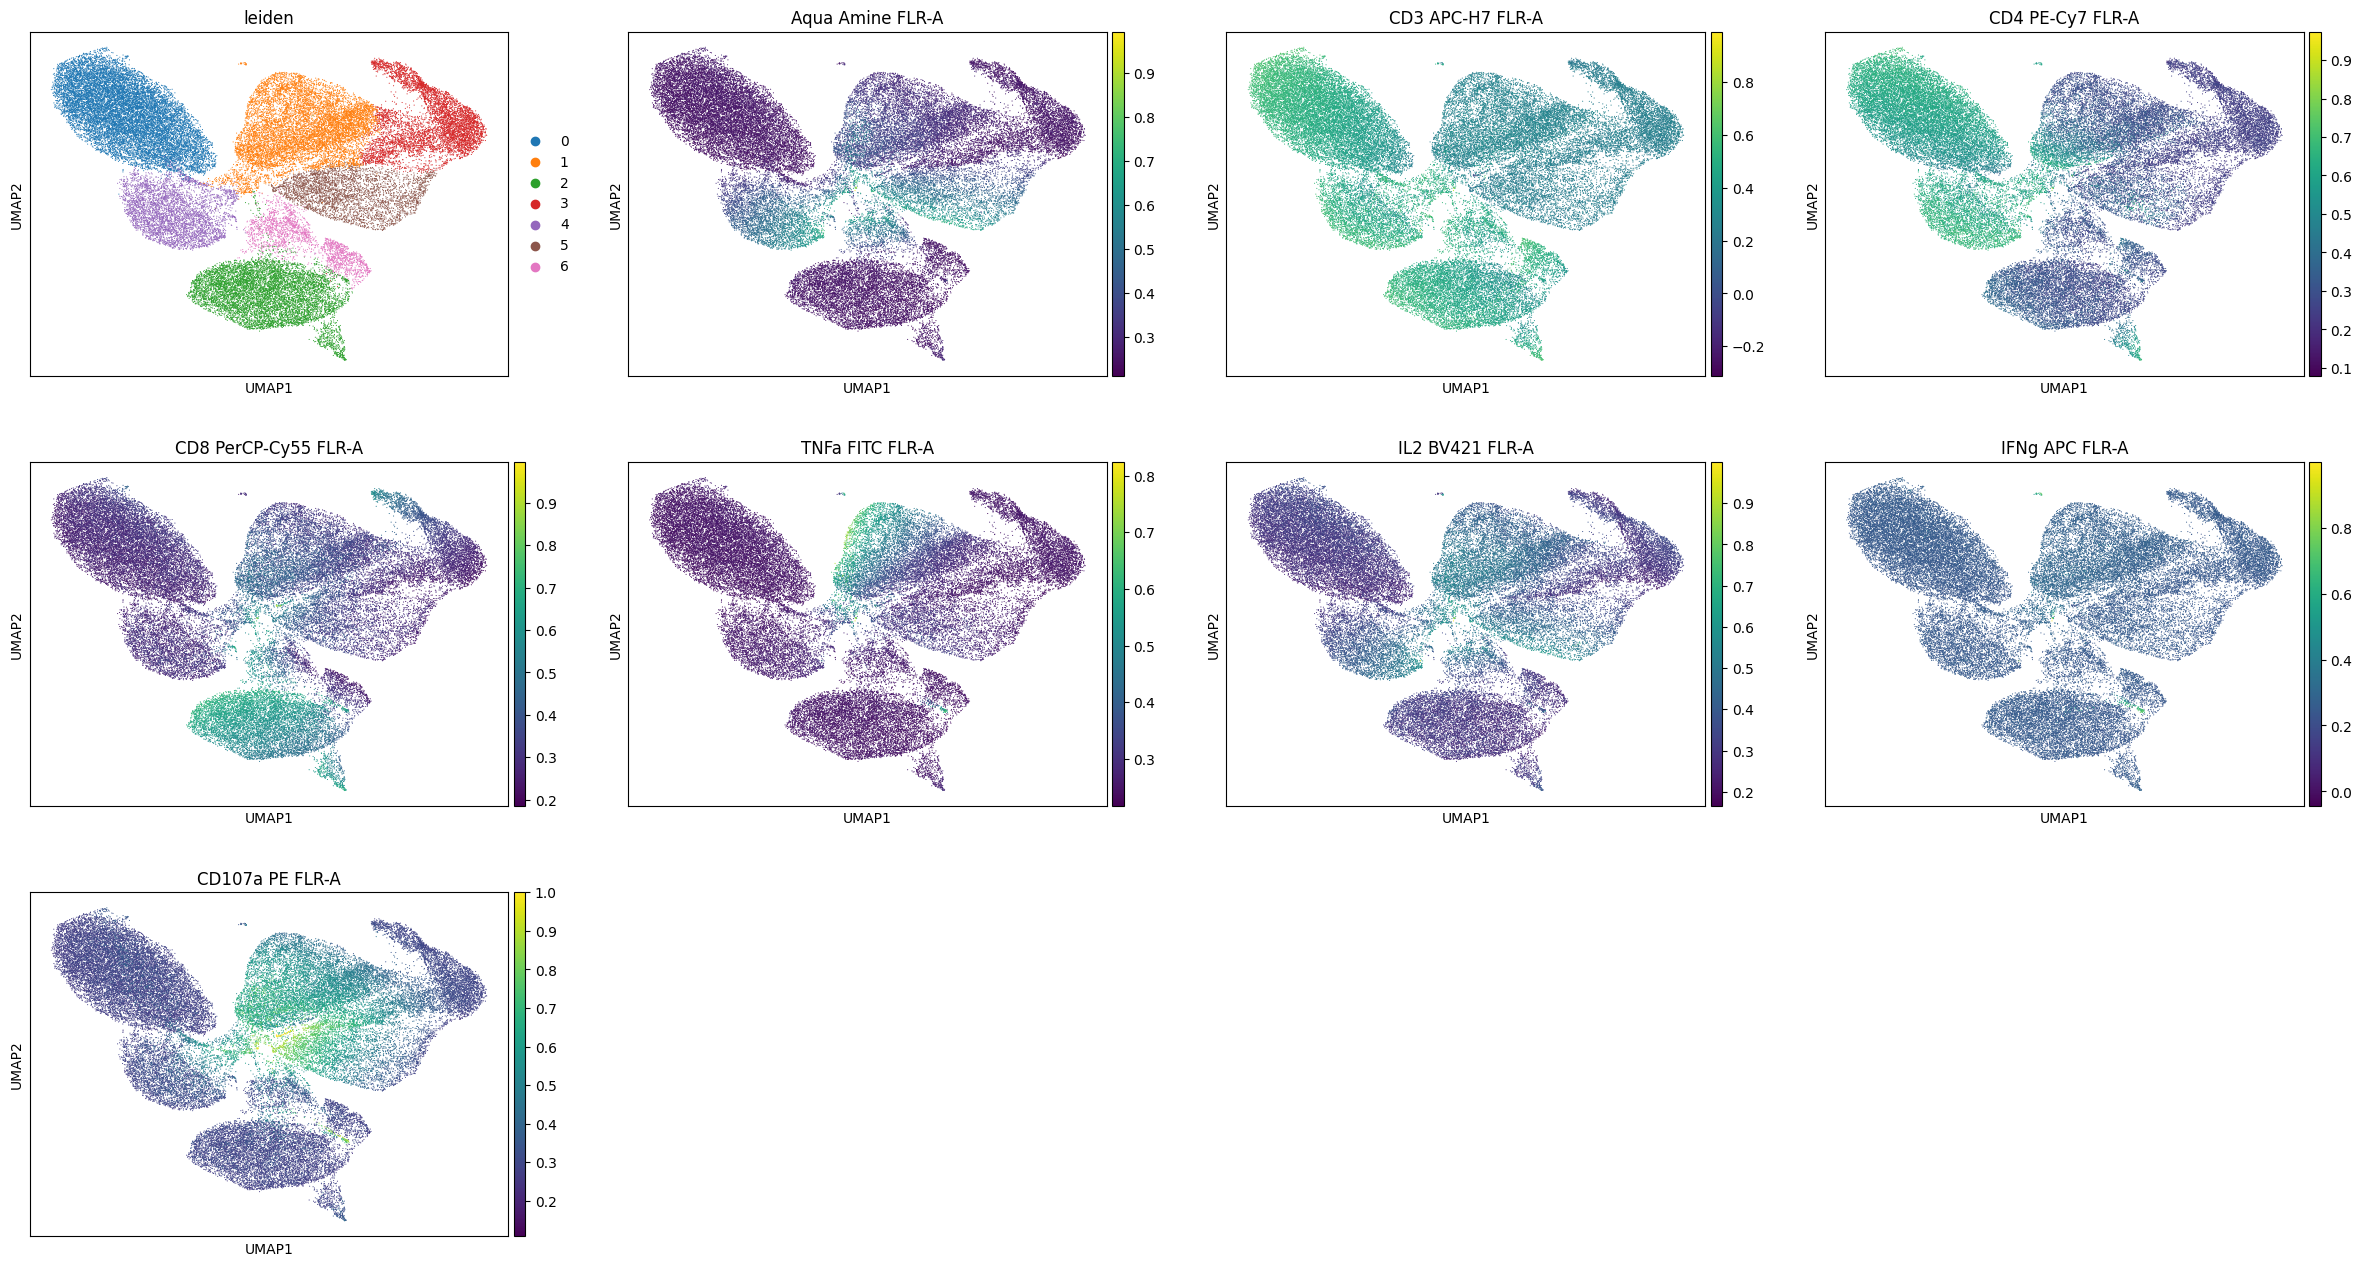
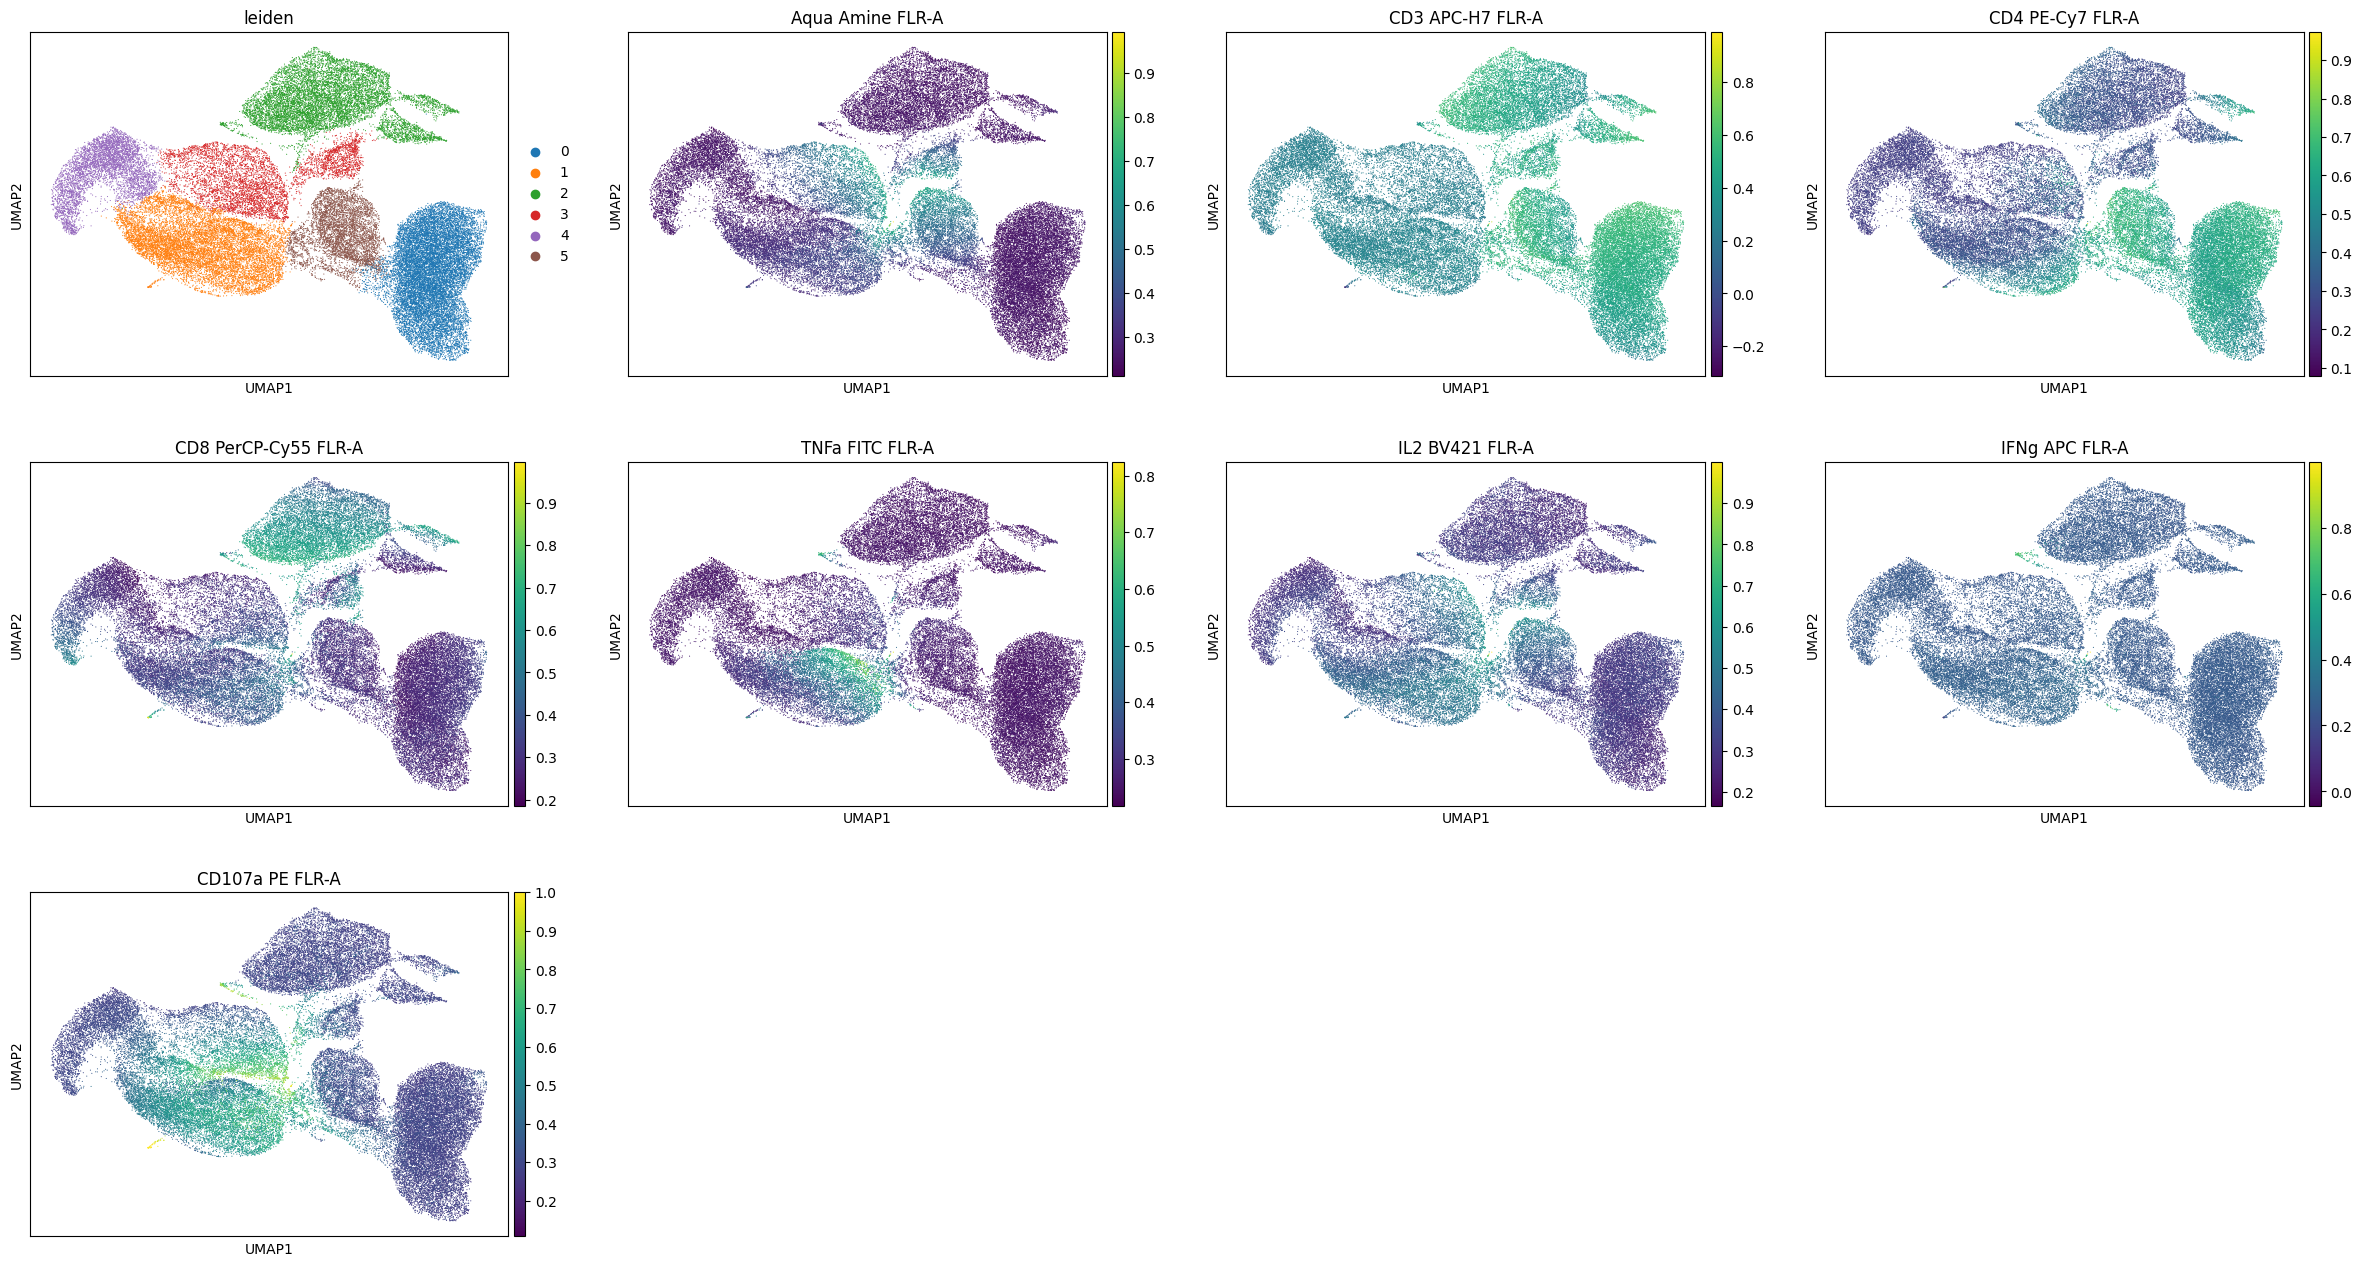
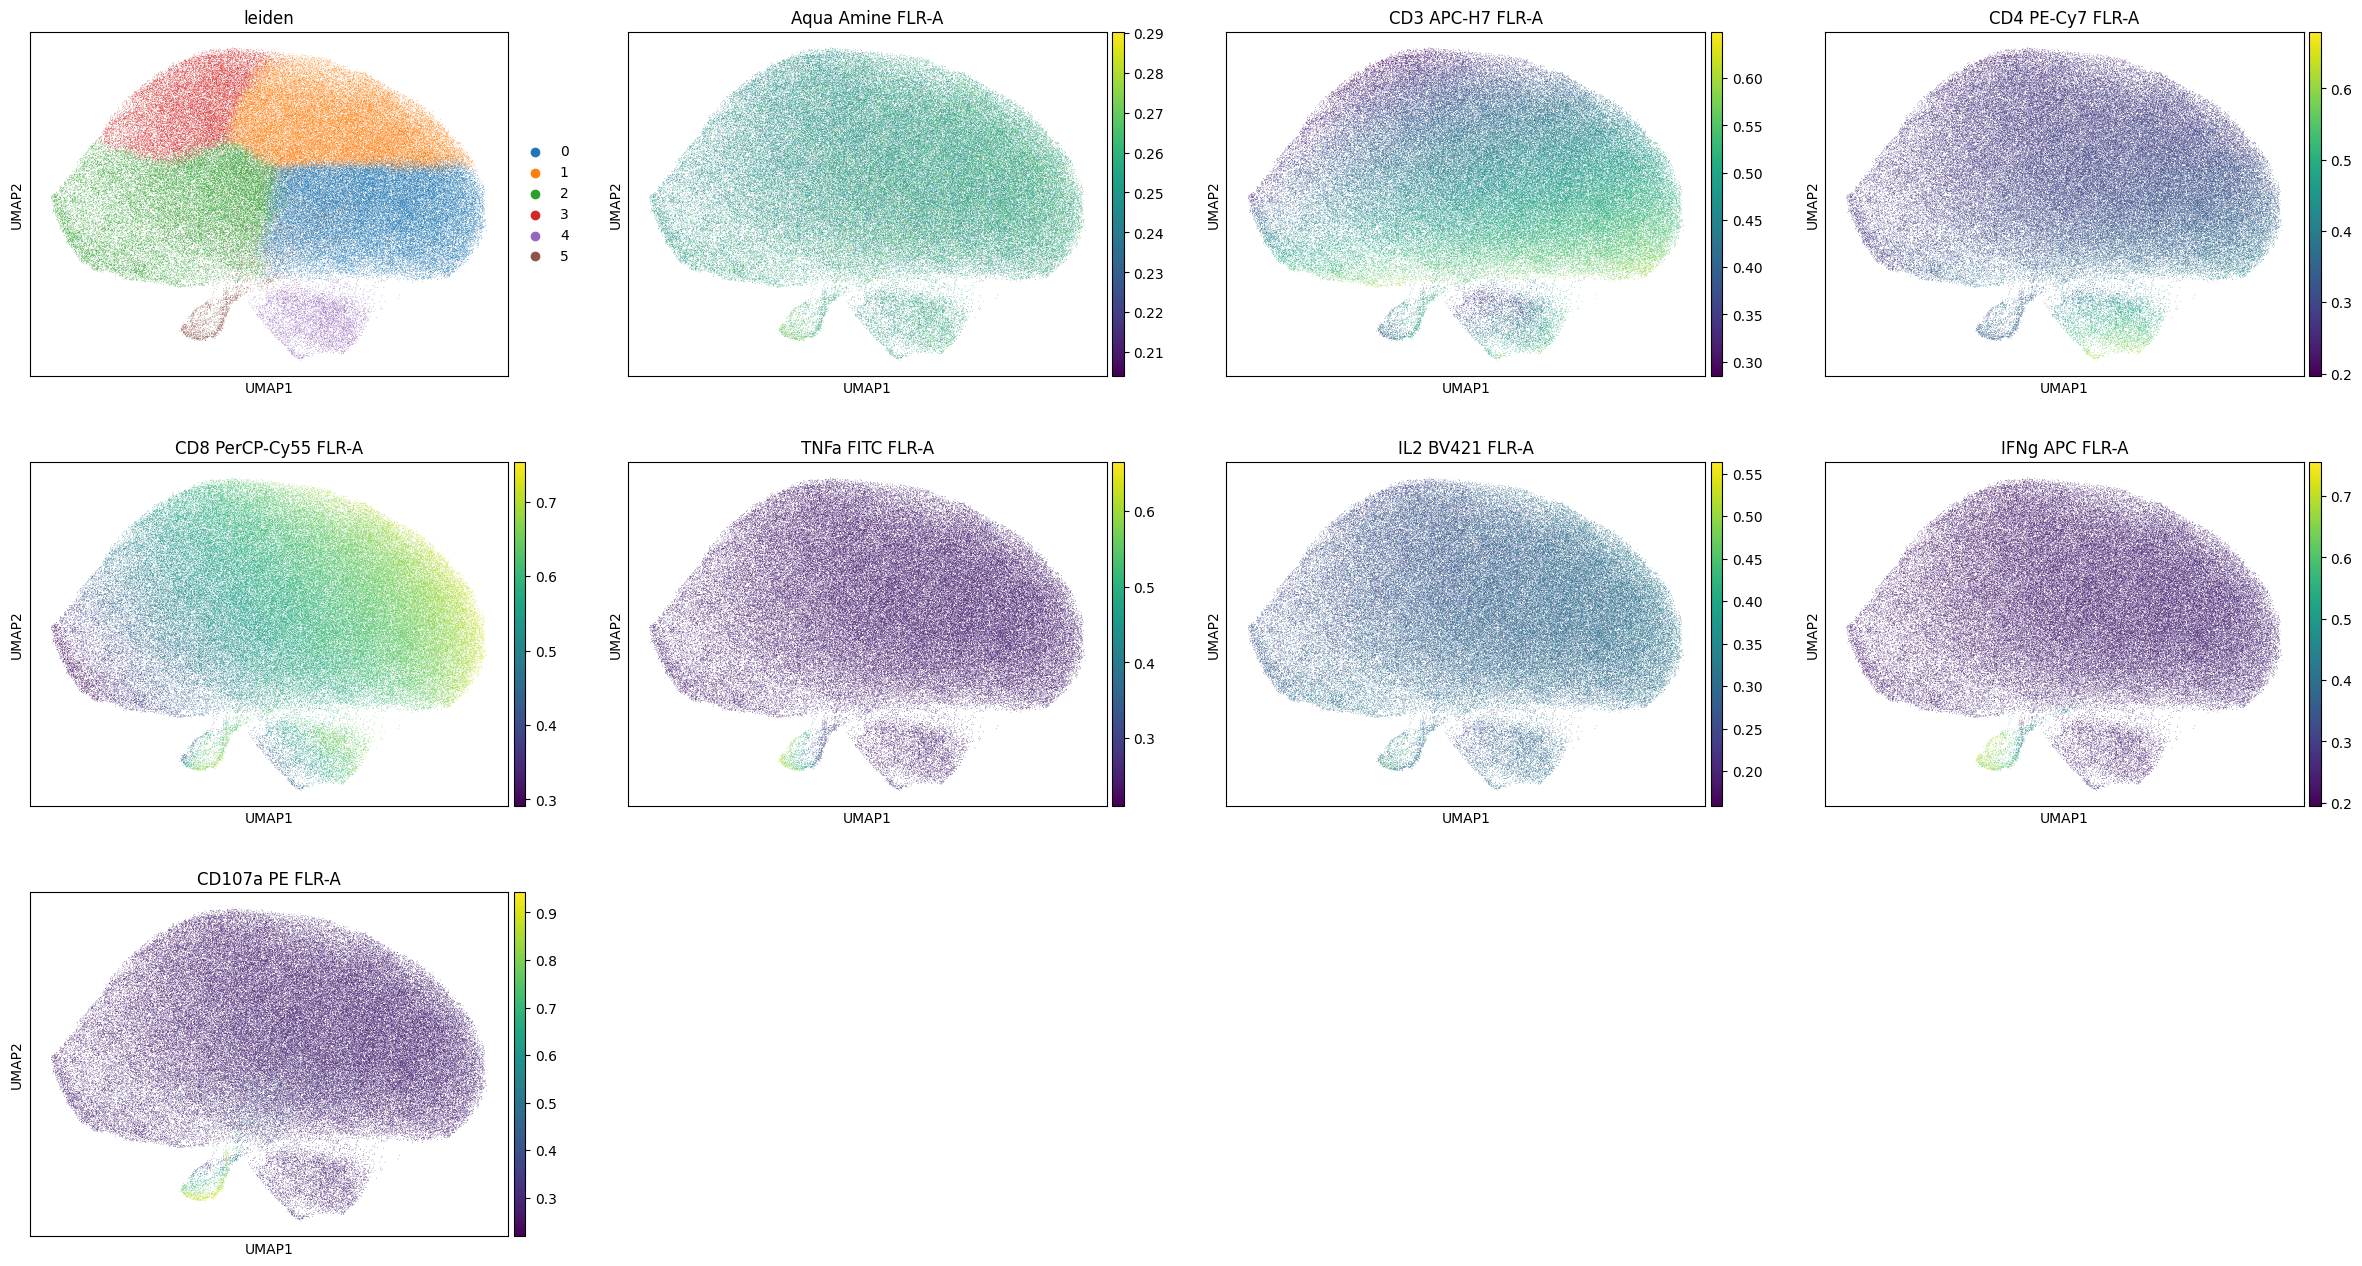
[47]:
%%time
sc.pl.umap(data, color=['leiden'] + markers)
CPU times: user 1.68 s, sys: 2.02 ms, total: 1.68 s
Wall time: 1.68 s
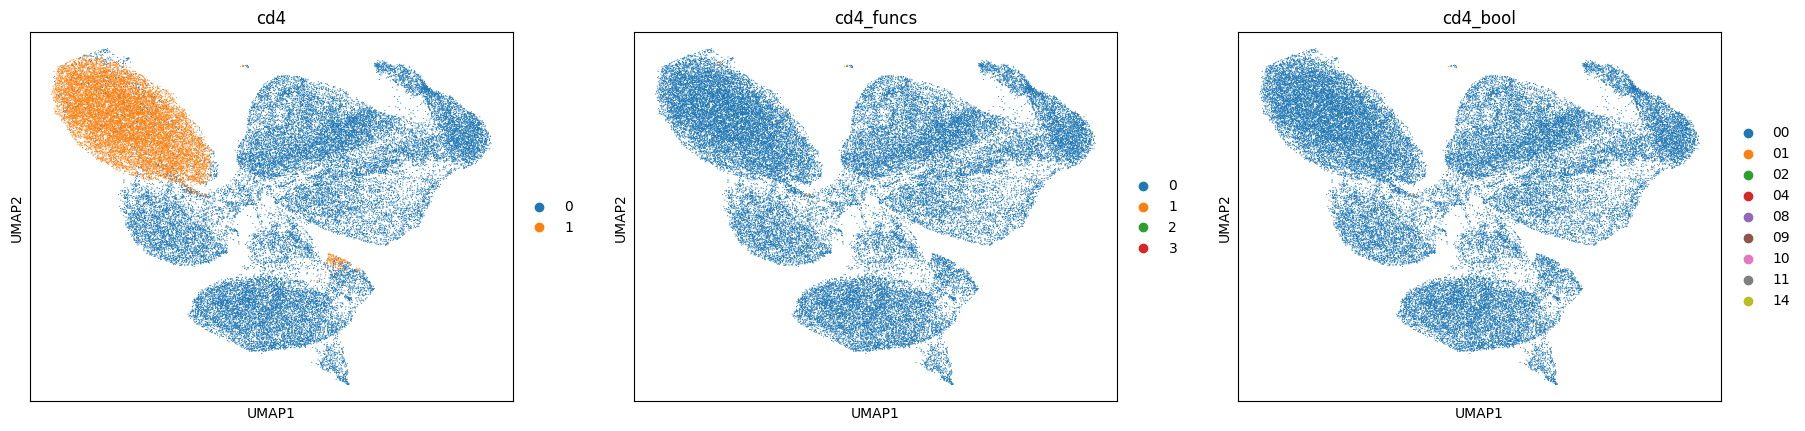
[48]:
%%time
sc.pl.umap(data, color=['cd4', 'cd4_funcs', 'cd4_bool'], cmap='turbo')
CPU times: user 664 ms, sys: 2.98 ms, total: 667 ms
Wall time: 668 ms
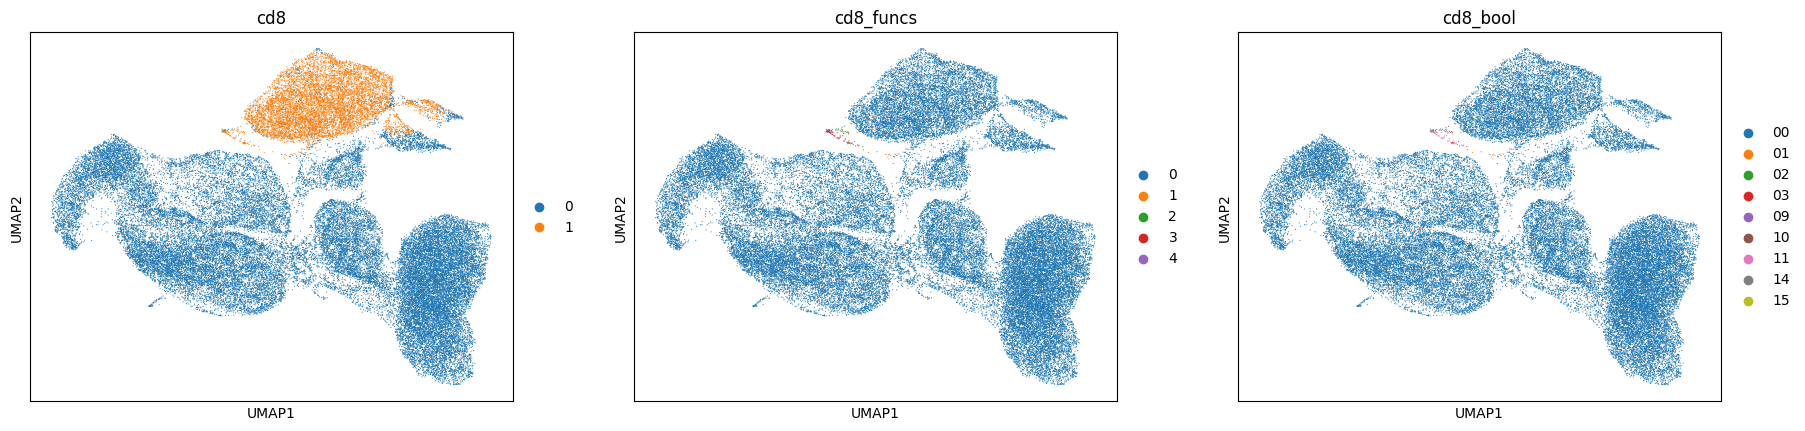
[49]:
sc.pl.umap(data, color=['cd8', 'cd8_funcs', 'cd8_bool'], cmap='turbo')
[50]:
sc.tl.embedding_density(
    data,
    groupby='cd4'
)
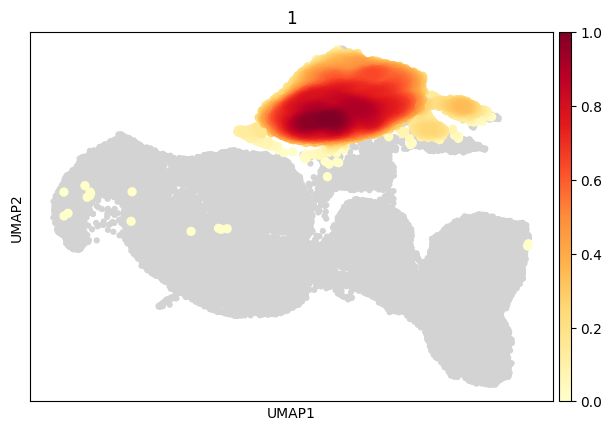
[51]:
sc.pl.embedding_density(
    data,
    groupby='cd4',
    group='1'
)
[52]:
sc.tl.embedding_density(
    data,
    groupby='cd4_funcs'
)
[53]:
sc.pl.embedding_density(
    data,
    groupby='cd4_funcs',
    group=['1','2','3']
)
[54]:
sc.tl.embedding_density(
    data,
    groupby='cd8'
)
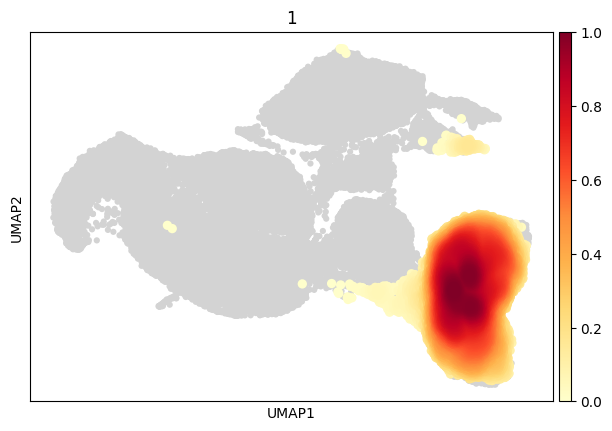
[55]:
sc.pl.embedding_density(
    data,
    groupby='cd8',
    group='1'
)
[56]:
sc.tl.embedding_density(
    data,
    groupby='cd8_funcs',
)
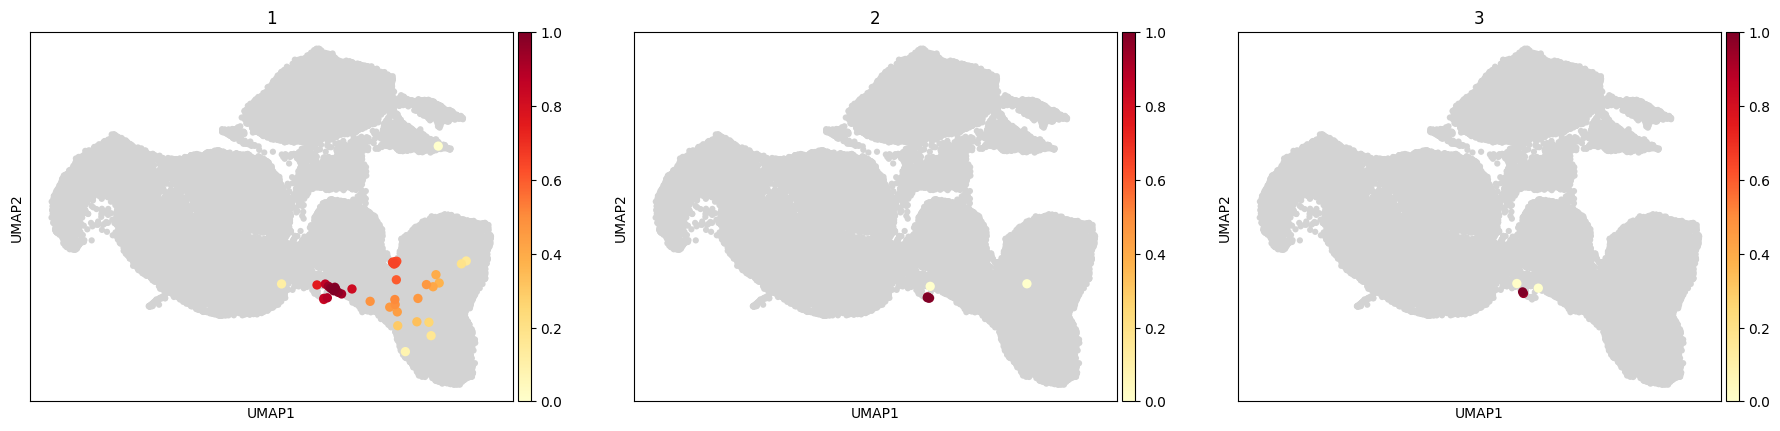
[57]:
sc.pl.embedding_density(
    data,
    groupby='cd8_funcs',
    group=['1', '2', '3', '4'],

)
Next example: Repeat but for CD8 T cells only
[58]:
cd8_data = adata[adata.obsm['gate_membership']['root:Time:Singlets:aAmine-:CD3+:CD8+']]
[59]:
cd8_data
[59]:
View of AnnData object with n_obs × n_vars = 140676 × 8
    obs: 'sample_id', 'cd4', 'cd4_bool', 'cd4_funcs', 'cd8', 'cd8_bool', 'cd8_funcs'
    uns: 'gate_hierarchy', 'transforms'
    obsm: 'gate_membership'
[60]:
sc.pp.neighbors(cd8_data, n_neighbors=30, n_pcs=0)
[61]:
sc.tl.leiden(cd8_data, resolution=0.2, flavor='leidenalg')
[62]:
sc.tl.paga(cd8_data)
[63]:
sc.pl.paga(cd8_data)
[64]:
sc.tl.umap(cd8_data, init_pos='paga')
[65]:
sc.pl.umap(
    cd8_data,
    color=['leiden'] + markers,
)
[66]:
sc.tl.embedding_density(
    cd8_data,
    groupby='leiden'
)
[67]:
sc.pl.embedding_density(
    cd8_data,
    groupby='leiden',
)
Finding markers
[68]:
sc.tl.rank_genes_groups(
    cd8_data,
    groupby='leiden',
    method='wilcoxon'
)
[69]:
sc.pl.violin(cd8_data, markers, groupby='leiden')

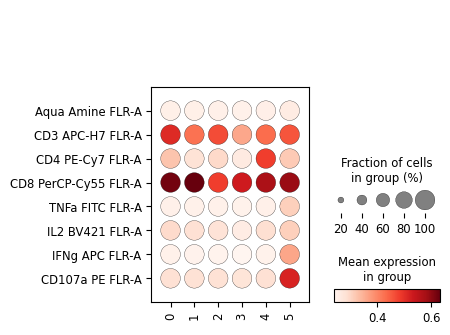
[70]:
sc.pl.dotplot(cd8_data, markers, groupby='leiden', swap_axes=True)
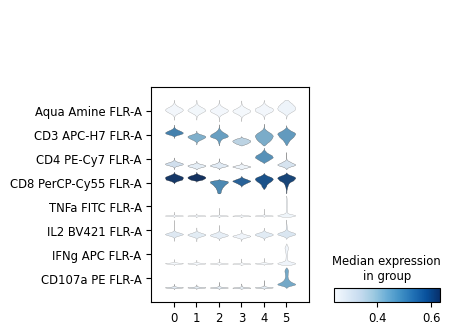
[71]:
sc.pl.stacked_violin(cd8_data, markers, groupby='leiden', swap_axes=True)

[72]:
sc.tl.dendrogram(cd8_data, groupby='leiden')
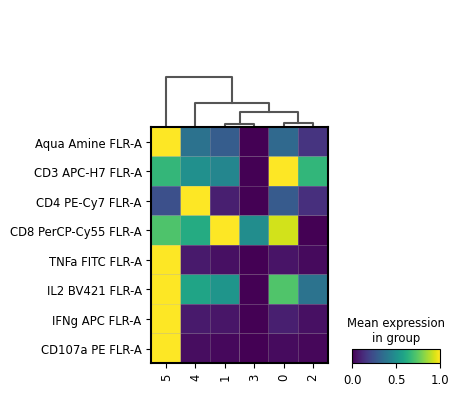
[73]:
sc.pl.matrixplot(
    cd8_data,
    markers,
    groupby='leiden',
    swap_axes=True,
    standard_scale='var',
    log=False,
    dendrogram=True,
)
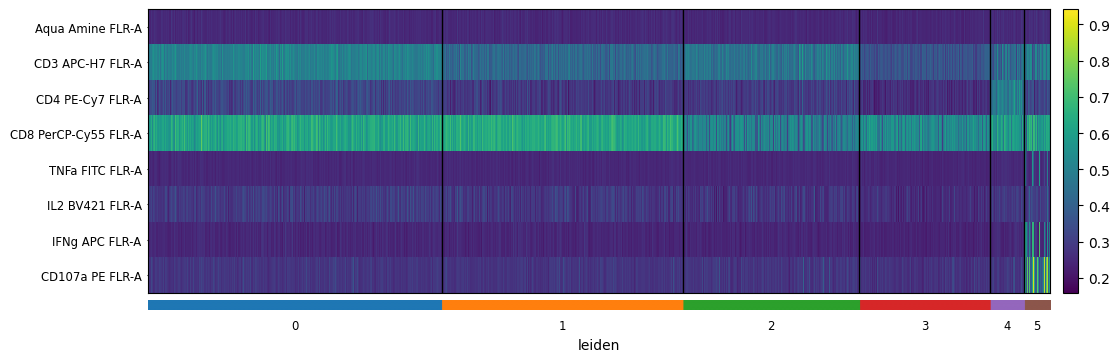
[74]:
sc.pl.heatmap(
    cd8_data,
    markers,
    groupby='leiden',
    swap_axes=True,
    figsize=(12,4)
)
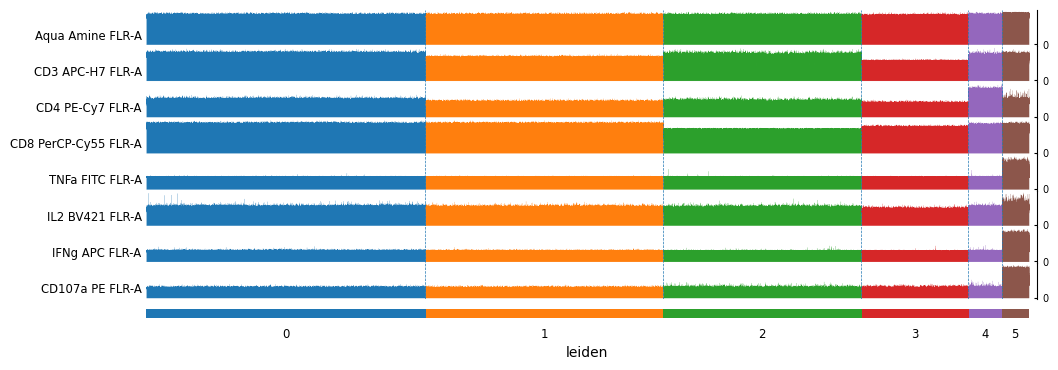
[75]:
sc.pl.tracksplot(
    cd8_data,
    markers,
    groupby='leiden',
    swap_axes=True,
    figsize=(12,4)
)
[76]:
cd8_data.layers['scaled'] = sc.pp.scale(cd8_data, copy=True).X
[77]:
sc.pl.rank_genes_groups_matrixplot(
    cd8_data,
    n_genes=4,
    use_raw=False,
    vmin=-3,
    vmax=3,
    cmap='bwr',
    layer='scaled',
    swap_axes=True
)
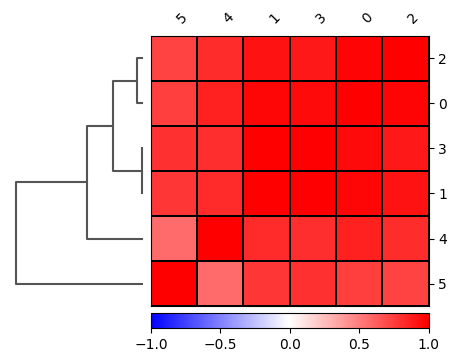
[78]:
sc.pl.correlation_matrix(
    cd8_data,
    groupby='leiden',
)
[ ]: