Compare Mean Fluorescence Intensity of Gated Events
[1]:
import os
import numpy as np
import pandas as pd

import flowkit as fk

%matplotlib inline
Load FlowJo Workspace
[1]:
base_dir = "../../../data/8_color_data_set"

sample_path = os.path.join(base_dir, "fcs_files")
wsp_path = os.path.join(base_dir, "8_color_ICS.wsp")
---------------------------------------------------------------------------
NameError                                 Traceback (most recent call last)
Cell In[1], line 3
      1 base_dir = "../../../data/8_color_data_set"
----> 3 sample_path = os.path.join(base_dir, "fcs_files")
      4 wsp_path = os.path.join(base_dir, "8_color_ICS.wsp")

NameError: name 'os' is not defined
[ ]:
workspace = fk.Workspace(wsp_path, fcs_samples=sample_path)
[4]:
workspace.summary()
[4]:
| samples | loaded_samples | gates | max_gate_depth | |
|---|---|---|---|---|
| group_name | ||||
| All Samples | 3 | 3 | 14 | 6 |
| DEN | 3 | 3 | 14 | 6 |
| GEN | 0 | 0 | 0 | 0 |
| G69 | 0 | 0 | 0 | 0 |
| Lyo Cells | 0 | 0 | 0 | 0 |
[5]:
sample_ids = workspace.get_sample_ids('DEN')
[6]:
sample_ids
[6]:
['101_DEN084Y5_15_E01_008_clean.fcs',
 '101_DEN084Y5_15_E03_009_clean.fcs',
 '101_DEN084Y5_15_E05_010_clean.fcs']
[7]:
# choose a sample ID
sample_id = '101_DEN084Y5_15_E03_009_clean.fcs'
sample = workspace.get_sample(sample_id)
Review the gate hierachy
[8]:
print(workspace.get_gate_hierarchy(sample_id, 'ascii'))
root
╰── Time
    ╰── Singlets
        ╰── aAmine-
            ╰── CD3+
                ├── CD4+
                │   ├── CD107a+
                │   ├── IFNg+
                │   ├── IL2+
                │   ╰── TNFa+
                ╰── CD8+
                    ├── CD107a+
                    ├── IFNg+
                    ├── IL2+
                    ╰── TNFa+
Process gates for the sample group
[9]:
workspace.analyze_samples(sample_id=sample_id)
Get gated events for a sample
[10]:
cd4_gate_name = 'CD4+'
cd4_events = workspace.get_gate_events(sample_id, cd4_gate_name)
[11]:
sample.event_count, cd4_events.shape[0]
[11]:
(283969, 81855)
[12]:
cd4_events.head(5)
[12]:
| sample_id | FSC-A | FSC-H | FSC-W | SSC-A | SSC-H | SSC-W | TNFa FITC FLR-A | CD8 PerCP-Cy55 FLR-A | IL2 BV421 FLR-A | Aqua Amine FLR-A | IFNg APC FLR-A | CD3 APC-H7 FLR-A | CD107a PE FLR-A | CD4 PE-Cy7 FLR-A | Time | |
|---|---|---|---|---|---|---|---|---|---|---|---|---|---|---|---|---|
| 1 | 101_DEN084Y5_15_E03_009_clean.fcs | 0.484332 | 0.397831 | 0.304358 | 0.178974 | 0.165913 | 0.269681 | 0.242188 | 0.230791 | 0.282167 | 0.254901 | 0.244743 | 0.454572 | 0.276832 | 0.610560 | 0.029446 |
| 6 | 101_DEN084Y5_15_E03_009_clean.fcs | 0.858325 | 0.713455 | 0.300763 | 0.160702 | 0.149963 | 0.267902 | 0.255704 | 0.297297 | 0.270034 | 0.259815 | 0.232809 | 0.383849 | 0.272156 | 0.476992 | 0.029638 |
| 7 | 101_DEN084Y5_15_E03_009_clean.fcs | 0.499515 | 0.389256 | 0.320814 | 0.160819 | 0.148792 | 0.270207 | 0.542186 | 0.298411 | 0.430466 | 0.270496 | 0.720327 | 0.324062 | 0.353662 | 0.604535 | 0.029652 |
| 9 | 101_DEN084Y5_15_E03_009_clean.fcs | 0.427556 | 0.346325 | 0.308638 | 0.181880 | 0.169140 | 0.268832 | 0.256053 | 0.305138 | 0.332638 | 0.251144 | 0.226288 | 0.607199 | 0.369072 | 0.423495 | 0.029680 |
| 16 | 101_DEN084Y5_15_E03_009_clean.fcs | 0.527936 | 0.415756 | 0.317456 | 0.103247 | 0.096481 | 0.267532 | 0.241784 | 0.235227 | 0.283300 | 0.246906 | 0.251326 | 0.454224 | 0.306893 | 0.487684 | 0.029858 |
Calculate means for channels of interest
[13]:
fluoro_labels = []
for chan_idx in sample.fluoro_indices:
    fluoro_labels.append(sample.pnn_labels[chan_idx])
[14]:
cd4_events = cd4_events[fluoro_labels]
[15]:
cd4_mfi = cd4_events.mean()
[16]:
cd4_mfi
[16]:
TNFa FITC FLR-A         0.248338
CD8 PerCP-Cy55 FLR-A    0.274010
IL2 BV421 FLR-A         0.288348
Aqua Amine FLR-A        0.250962
IFNg APC FLR-A          0.246429
CD3 APC-H7 FLR-A        0.488177
CD107a PE FLR-A         0.279935
CD4 PE-Cy7 FLR-A        0.588879
dtype: float64
Let’s compare MFI between CD4+ & CD8+
[17]:
cd8_gate_name = 'CD8+'
cd8_events = workspace.get_gate_events(sample_id, cd8_gate_name)

cd8_mfi = cd8_events[fluoro_labels].mean()
[18]:
mfi_comparison = pd.DataFrame([cd4_mfi, cd8_mfi], index=[cd4_gate_name, cd8_gate_name])
[19]:
mfi_comparison
[19]:
| TNFa FITC FLR-A | CD8 PerCP-Cy55 FLR-A | IL2 BV421 FLR-A | Aqua Amine FLR-A | IFNg APC FLR-A | CD3 APC-H7 FLR-A | CD107a PE FLR-A | CD4 PE-Cy7 FLR-A | |
|---|---|---|---|---|---|---|---|---|
| CD4+ | 0.248338 | 0.274010 | 0.288348 | 0.250962 | 0.246429 | 0.488177 | 0.279935 | 0.588879 |
| CD8+ | 0.250975 | 0.584248 | 0.283504 | 0.251208 | 0.252061 | 0.459689 | 0.292997 | 0.308986 |
[20]:
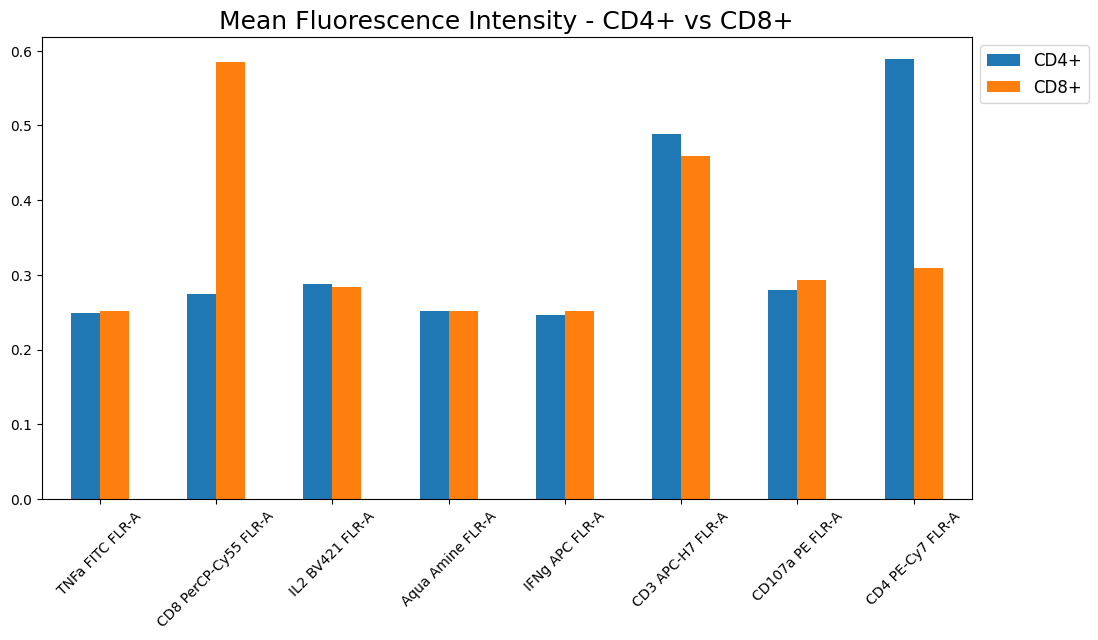
mfi_comparison = mfi_comparison.transpose()
[21]:
mfi_comparison
[21]:
| CD4+ | CD8+ | |
|---|---|---|
| TNFa FITC FLR-A | 0.248338 | 0.250975 |
| CD8 PerCP-Cy55 FLR-A | 0.274010 | 0.584248 |
| IL2 BV421 FLR-A | 0.288348 | 0.283504 |
| Aqua Amine FLR-A | 0.250962 | 0.251208 |
| IFNg APC FLR-A | 0.246429 | 0.252061 |
| CD3 APC-H7 FLR-A | 0.488177 | 0.459689 |
| CD107a PE FLR-A | 0.279935 | 0.292997 |
| CD4 PE-Cy7 FLR-A | 0.588879 | 0.308986 |
[22]:
ax = mfi_comparison.plot.bar(figsize=(12, 6))
ax.set_title("Mean Fluorescence Intensity - CD4+ vs CD8+", color='black', fontsize=18)
ax.legend(bbox_to_anchor=(1.0, 1.0), fontsize=12)
ax.set_xticklabels(ax.get_xticklabels(), rotation=45)
ax.plot()
[22]:
[]
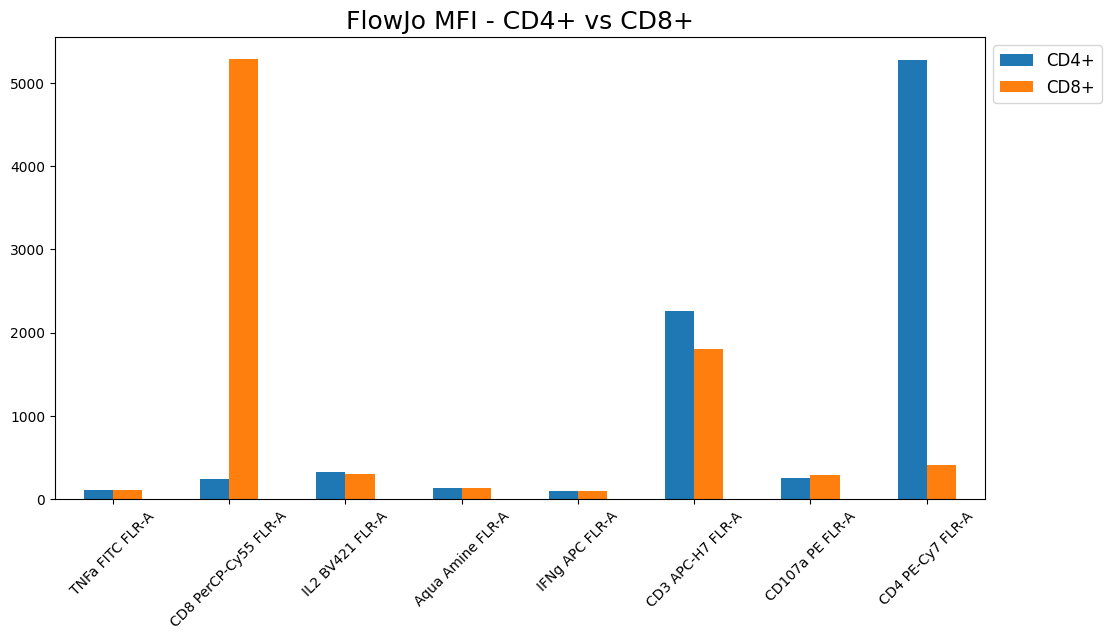
Matching FlowJo’s MFI
If you run the above code on your data and compare to the MFI reported in FlowJo, you may be asking: Why do my numbers not match FlowJo?
FlowJo users may have various ways they calculate statistcs. Often you’ll find they use the median for MFI, which is arguably a better statistic to use. You may also find that they calculate that median on the compensated but not transformed data. To reiterate what the FlowJo documentation says, it is always best to explicitly define what you mean by “MFI” when reporting it as a statistic.
Here we’ll replicate the above analysis, but use the median on the compensated, untransformed event data.
[23]:
# Use the 'source' kwarg to specify just the compensated events
cd4_events_comp = workspace.get_gate_events(sample_id, cd4_gate_name, source='comp')
cd8_events_comp = workspace.get_gate_events(sample_id, cd8_gate_name, source='comp')
[24]:
# Calculate the median on those extracted gated populations
cd4_fj_mfi = cd4_events_comp[fluoro_labels].median()
cd8_fj_mfi = cd8_events_comp[fluoro_labels].median()
[25]:
fj_mfi_comparison = pd.DataFrame([cd4_fj_mfi, cd8_fj_mfi], index=[cd4_gate_name, cd8_gate_name])
[26]:
fj_mfi_comparison
[26]:
| TNFa FITC FLR-A | CD8 PerCP-Cy55 FLR-A | IL2 BV421 FLR-A | Aqua Amine FLR-A | IFNg APC FLR-A | CD3 APC-H7 FLR-A | CD107a PE FLR-A | CD4 PE-Cy7 FLR-A | |
|---|---|---|---|---|---|---|---|---|
| CD4+ | 111.288873 | 245.009334 | 328.600006 | 127.720001 | 95.450704 | 2259.295656 | 258.310234 | 5272.984266 |
| CD8+ | 111.935477 | 5287.526461 | 300.080017 | 128.960007 | 94.533422 | 1799.548660 | 286.533448 | 403.920880 |
[27]:
fj_mfi_comparison = fj_mfi_comparison.transpose()
[28]:
fj_mfi_comparison
[28]:
| CD4+ | CD8+ | |
|---|---|---|
| TNFa FITC FLR-A | 111.288873 | 111.935477 |
| CD8 PerCP-Cy55 FLR-A | 245.009334 | 5287.526461 |
| IL2 BV421 FLR-A | 328.600006 | 300.080017 |
| Aqua Amine FLR-A | 127.720001 | 128.960007 |
| IFNg APC FLR-A | 95.450704 | 94.533422 |
| CD3 APC-H7 FLR-A | 2259.295656 | 1799.548660 |
| CD107a PE FLR-A | 258.310234 | 286.533448 |
| CD4 PE-Cy7 FLR-A | 5272.984266 | 403.920880 |
[29]:
ax = fj_mfi_comparison.plot.bar(figsize=(12, 6))
ax.set_title("FlowJo MFI - CD4+ vs CD8+", color='black', fontsize=18)
ax.legend(bbox_to_anchor=(1.0, 1.0), fontsize=12)
ax.set_xticklabels(ax.get_xticklabels(), rotation=45)
ax.plot()
[29]:
[]
[ ]: